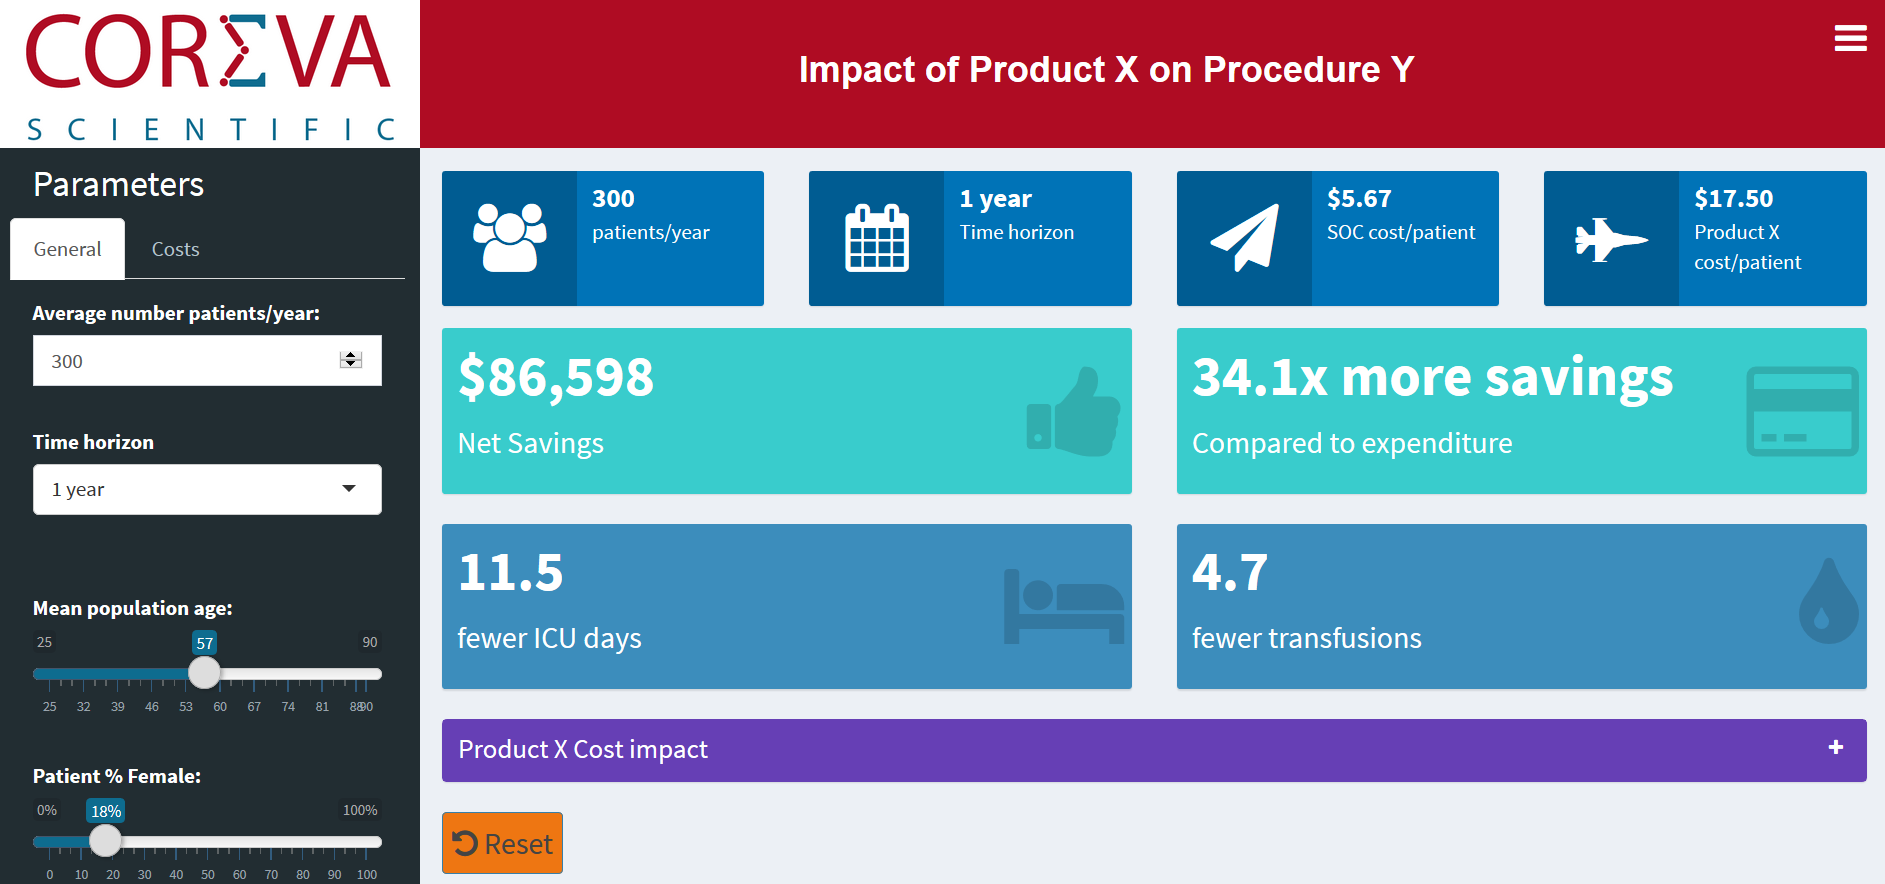
If a picture is worth 1,000 words then an interactive picture is priceless. Having taken the time to develop a comprehensive health economic model, prepare the publication, and ready the marketing team – there is still the question of how to quickly and simply communicate your key messages. One approach is to distil the complex model down to an easy to digest web or tablet app. The example here gives a taste of exactly what can be achieved.
In general, health economic model development begins with Excel. It is often required to facilitate easy review by Health Technology Assessment (HTA) bodies and internal stakeholders. Once mastered, Excel is a powerful tool, but it is built for data analysis and not data communication. Publishing the peer-reviewed manuscript is one messaging piece, but successful communication directly to your customers is the key to gaining sales. So if health economic modelling begins with Excel, where does it end?
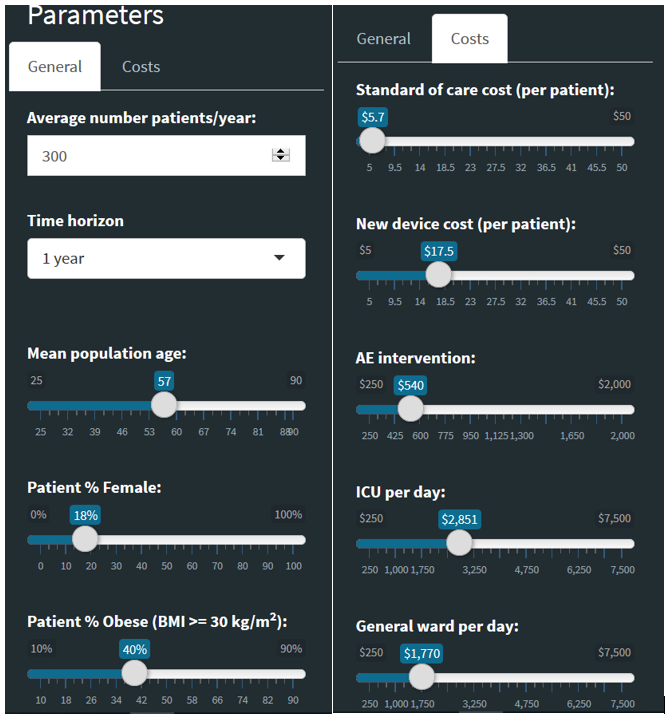
Now you have the option of impressing customers with a graphical message driven by the model data. Using mobile or tablet apps and web services, Coreva Scientific can develop powerful interactive tools, customized to your needs. These will help your customers visualize and engage with the outcomes generated by your model. Via an interactive interface you interact with the data, drawing out budget savings, cost drivers, and value. Your customer can update the model via intuitive use of slider bars and drop-down options, adjusting the analysis quickly and easily to their specific needs. You are not showing them your product but allowing them to discover your solution.
 Example of visualization app for budget impact model (BIM)
 example of interactive interface for BIM (adjustable parameters)
